
The immigrant economy, in numbers

Immigrant-owned employer companies
Share of U.S. employer companies owned by immigrants in 2022. Employer companies have paid employees beyond their owners.
USAFacts analysis of U.S. Census Bureau data · Published May 9, 2025
Immigrant nonemployer business owners
Share of nonemployer business owners who were immigrants in 2021. Nonemployer businesses have no paid employees.
USAFacts analysis of U.S. Census Bureau data · Published May 9, 2025
Fortune 500 companies with immigrant roots
Share of companies on the 2025 Fortune 500 list founded by immigrants or their children: 231 of 500 companies.
American Immigration Council · 2025 Fortune 500 analysis
Each figure refers to the year and business population shown. These measures describe different groups and should not be added together. Sources checked September 8, 2026.
Many origins. One shared future.
People living in the U.S. who were not U.S. citizens at birth.
55%
27.5 million people from these ten countries.
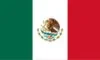



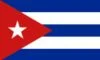
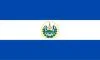


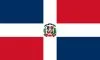
Rounded shares; M = million. China includes Hong Kong and Macao, excluding Taiwan. Bars compare shares. Population counts are shown only where stated in the article. These are people, not business owners. Source: MPI, 2024 ACS data; published March 12, 2026.
Roots across generations.
Immigrants and descendants tracing origin or ancestry to these countries. Most are U.S.-born.


Five largest diaspora groups reported by MPI. Rounded population estimates; not a count of foreign citizens or business owners. Source: MPI, 2024 estimates; published March 12, 2026.
TWO DIFFERENT QUESTIONS
Immigration:
Who moved here?
Diaspora:
Where do people trace their roots? Keep these populations separate; do not add the two charts.
Many languages. Everyday connections
73.04M Total speakers of languages other than English at home.
73M
Total speakers of languages other than English at home.
| Language | Speakers | Share of non-English home-language speakers |
|---|---|---|
| All non-English languages | 73,040,000 |
100.0%
|
| Spanish | 44,811,000 | |
| Chinese | 3,748,000 | |
| Tagalog | 1,947,000 | |
| Vietnamese | 1,604,000 | |
| Arabic | 1,501,000 | |
| French | 1,261,000 | |
| Korean | 1,140,000 | |
| Portuguese | 1,114,000 | |
| Hindi | 1,073,000 | |
| Haitian Creole | 1,035,000 | |
| Russian | 1,024,000 | |
| German | 856,000 | |
| Telugu | 594,000 | |
| Urdu | 565,000 | |
| Italian | 508,000 | |
| Polish | 503,000 | |
| Bengali | 498,000 | |
| Gujarati | 484,000 | |
| Japanese | 468,000 | |
| Farsi/Persian | 468,000 |